
Insights
Cloud Analyst Insights provide quick, focused answers to specific questions through single-chart visualizations.
Each Insight is designed to highlight key trends, usage patterns, or performance metrics, giving users immediate clarity on important topics.
Predefined Insights
env0 provides multiple predefined out of the box insights that answer common questions, you can see those in the Insights table, they will be marked with a verified icon.
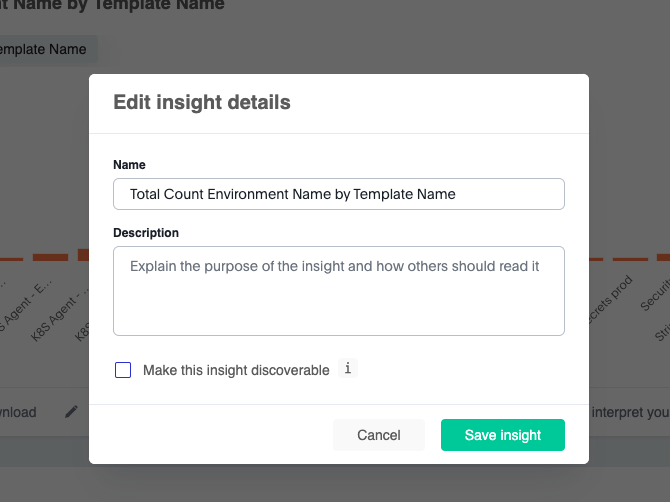
Create Your Own
Create your own insights by using the AI Chat Interface and hitting "Save" to save the results as an Insight, or by Create New Insight button on the Insights table.
Editing:
When Editing an insight, you can use the data search to directly specify fields, aggregations, filters and more in order to build your visualizations.
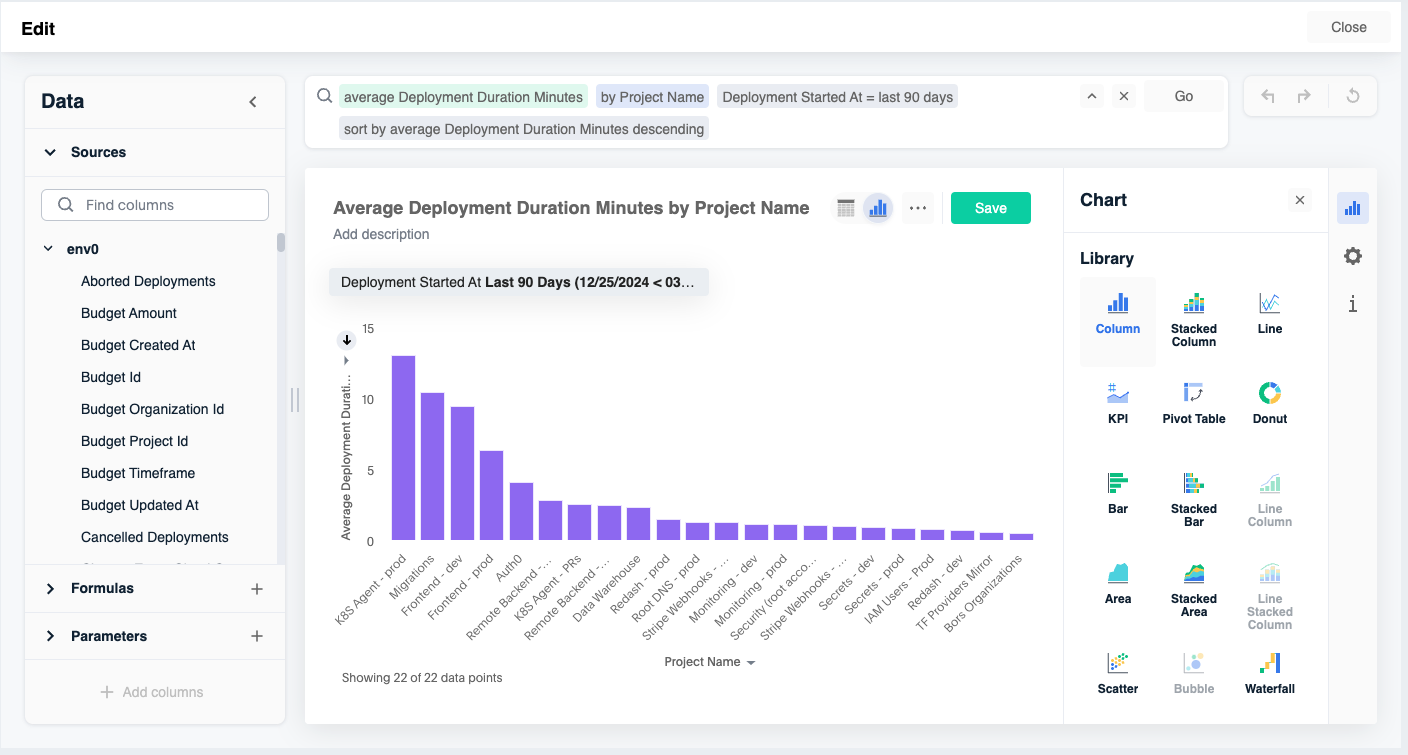
The Search Bar
The search bar allows an easy way to build your query. It is based on a list of keywords. Here are some keywords that can be used:
- Fields: Search the the field name you are interested in seeing such as "Environment Name". The fields are also visible on the left panel, and you can select them from there.
- Filters: You can add filters in different ways, such as
Environment Name=X, or keywords likeTop 5orBottom 10to limit the results. - Grouping: Add keywords like
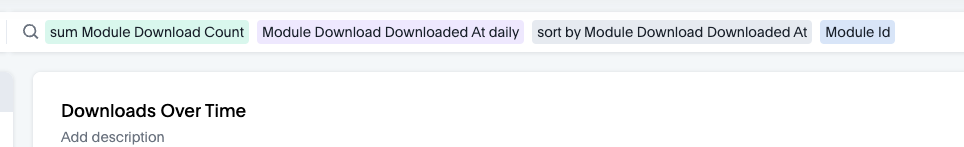
by Environment Typeto group by certain attributes - Aggregation: Add keywords like
count/sum/maxbefore attributes to count and aggregate measures - Sorting: Add keywords like
sort byto control the order
Insight Settings
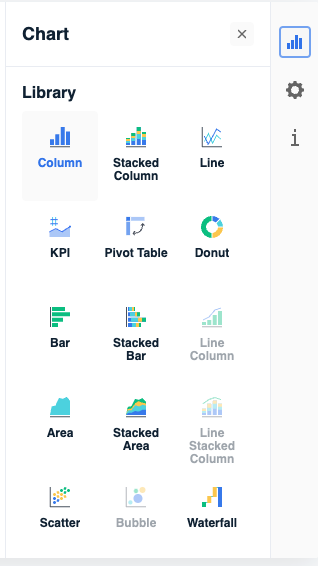
On the right panel, there are several options to help you customize the chart to your needs:
- Chart Library - Select the visualization that best serves your needs from a variety of over 20 options
- Chart Configuration - Configure the chart by setting up labels, assign fields to axis, and more.
- Query Details - See a breakdown of the full query details, to make sure it behaves as you expect.
- To view the data in a tabular format click on the
View Tableicon at the top
Fields, Formulas and Parameters
On the left panel you can see the full list of fields available in the env0 data model. You can select any field to construct your query, as well as use them along with filters or aggregations, as described above.
If you need to create a complex calculation, you can use Formulas.
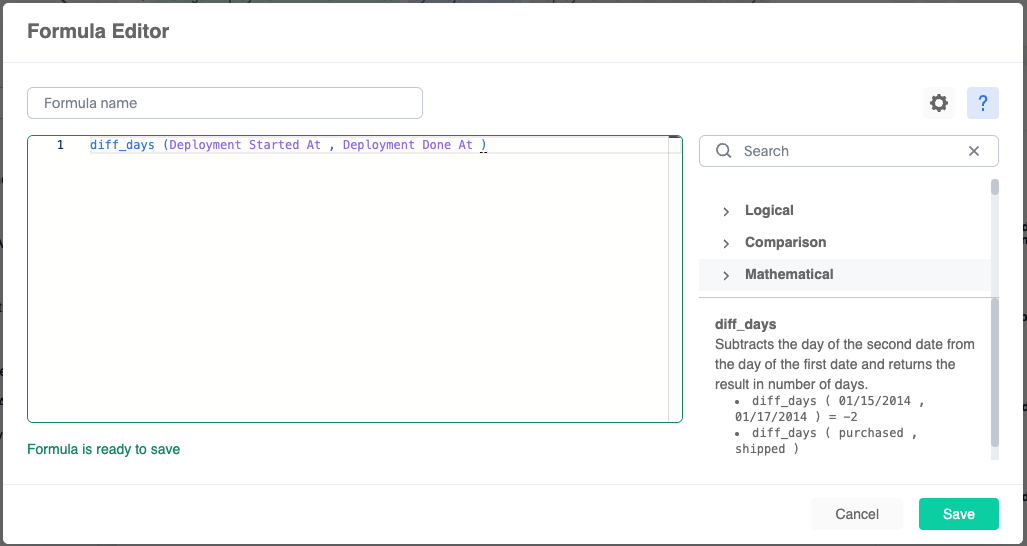
Formulas contain large number of functions that can be used while referencing attributes and measures from the env0 model. The functions along with their explanations are available in the formula editor.
Updated 11 days ago